Verizon
A data aggregation tool that reads real-time public sentiment and outage data to identify churn-risk customers, pairing each signal with a mitigation strategy.
2025
Software Engineer, UX Designer
Full Stack, UX
Aahil Nishaad, Afnan Tuffaha, Luis Sarmiento, Vichu Selveraju, Kai Tjia
The Problem
Verizon tracks churn with internal data that surfaces only after customers leave. Public warning signs like reviews, social posts, and outage reports go untracked, while churn costs more than $150M a quarter.
The Solution
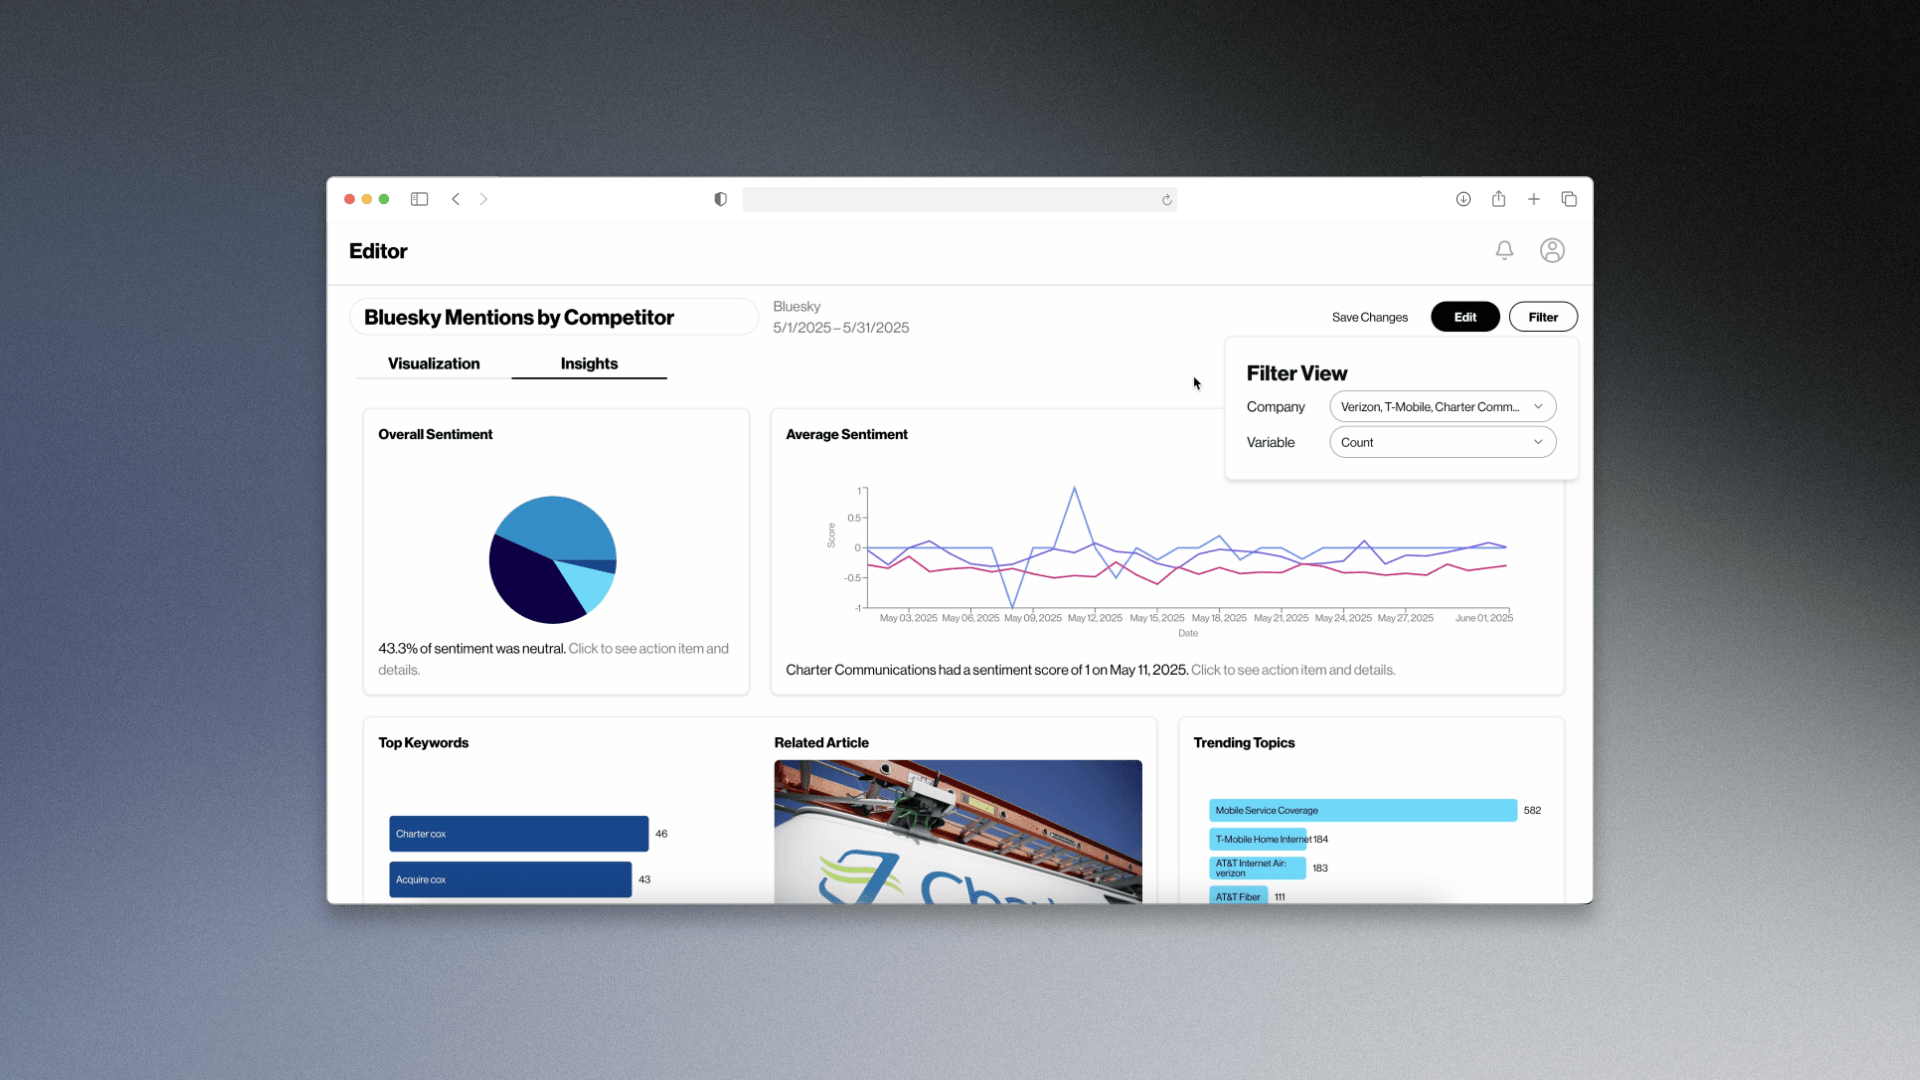
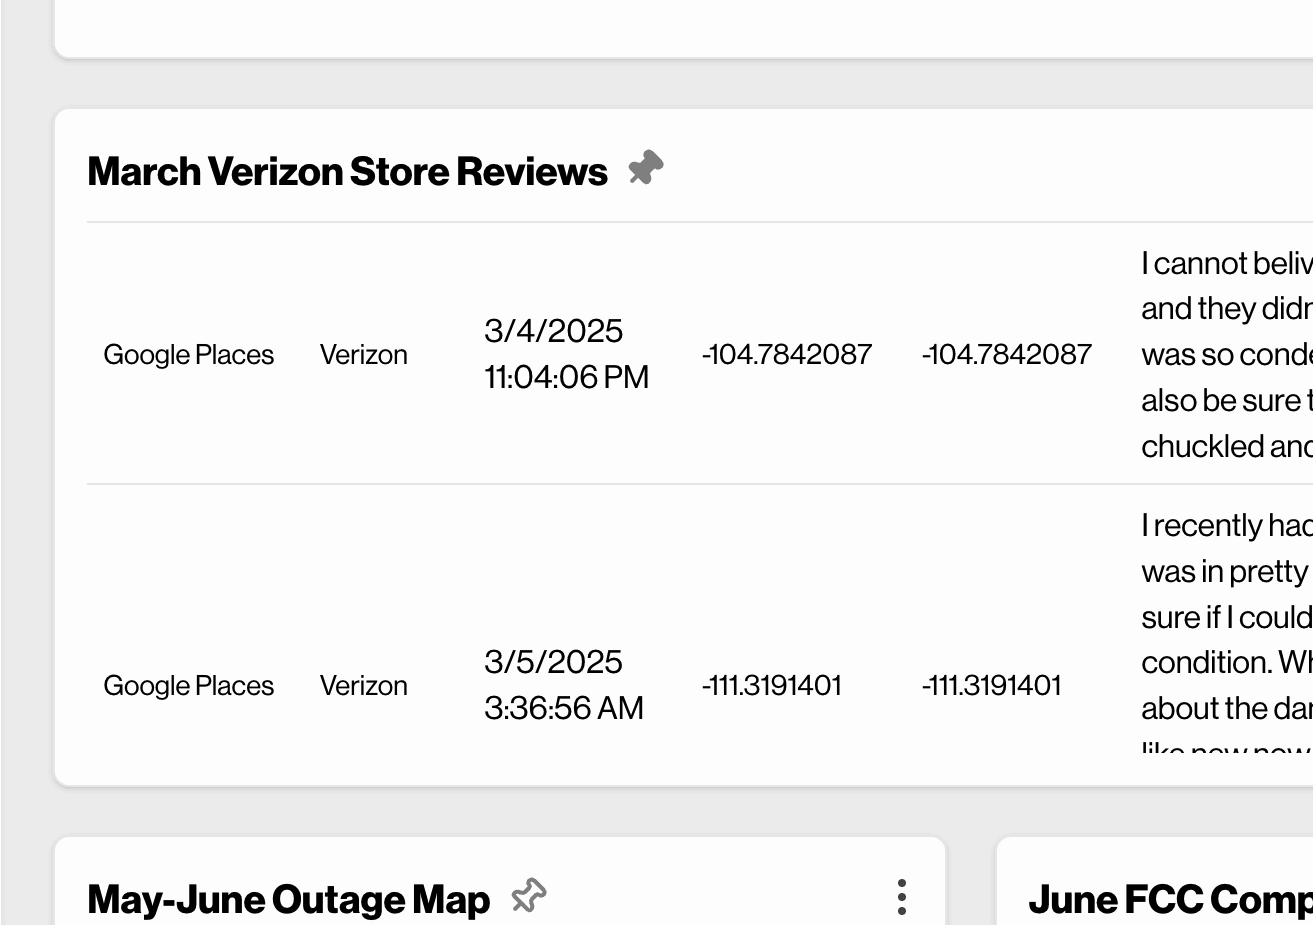
We built a dashboard that pulls daily data from five public sources, uses NLP to surface churn drivers, and pairs each one with a mitigation strategy.
Sorry! Some of this work is proprietary. Please reach out for further details
Key Design Decisions
Scoping our Machine Learning
We originally scoped a dashboard of structured metrics relating to network connectivity, but once we started data collection, most of the data turned out to be unstructured text, so I researched and owned the addition of an NLP layer for sentiment, keywords, and topics. The dashboard now shows themes and sentiment trends in conjunction with network connectivity trends.
Outcomes
Pulled together 170,000+ public data points and surfaced churn drivers that Verizon's own reporting had never caught.
Takeaways
→ As the only design/product voice on an engineering team, a large part of my role was translation. It took practice to understand how abstract requests can be parsed into scoped features.
→ Three major product decisions came from what we learned mid-build, not from the original scope. Being able to reassess and pivot made a huge positive impact on our end product.
Retrospective
→ Sentiment is scored per post, so a post that criticizes Verizon while praising a competitor still counts as positive. Per-entity sentiment is stored in the system, but visualizing it was deferred to future work.
→ I'd like to revisit our topic model to have the clusters update autonomously. Topic modeling relies on a hand-built mapping from raw clusters to business categories, so that mapping needs manual upkeep against industry trends as it is currently implemented.